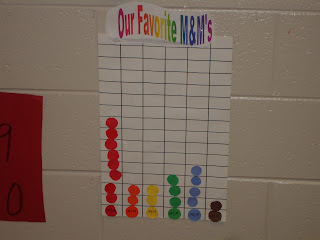
Picture Graphs of how many boys and girls were in our class and what our favorite M&M colors were. The M&M graph was done after each student made his/her own bar graph of the number of the different color M&M's they had in their fun size bag of M&M's!


No comments:
Post a Comment